
Work Related Deaths Per Year in Australia
Statistics, causes, and strategies to mitigate work-related fatalities in Australia. Covers fatality trends from 2003-2022 by industry, occupation, mechanism, age group, and state.
Work Related Deaths Per Year in Australia
In this FAQ article, we will delve into the statistics, causes, and strategies to mitigate work-related fatalities in Australia, shedding light on an issue that demands urgent attention. Statistics are from 2003 – 2022.
Video walkthrough
Statistics on Work-Related Deaths in Australia
Work-related fatalities in Australia have seen a positive decline over the past decade, thanks to concerted efforts to improve work health and safety. The number of worker fatalities in 2022 was 163, representing a fatality rate of 1.43 per 100,000 workers. While this number indicates progress, it is important to note that even a single work-related fatality is one too many.
Historical Fatality Trends
In the past 20 years, fatality rate per worker has almost halved from a high of 2.98 in 2004 (284 fatalities) to the current 1.43 in 2022 (195).
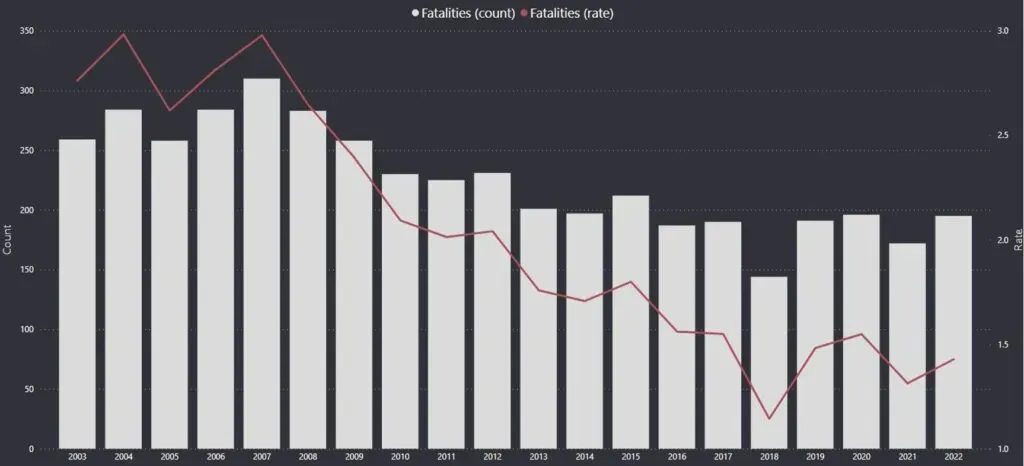
It's promising that despite the increase in workers and number of hours worked, the fatality rate is dropping.
Most Dangerous Industries in Australia
The mining industry, which has historically been one of the most dangerous industries, has witnessed significant improvements in safety measures, resulting in a decrease in fatalities. However, industries such as transport and logistics as well as agriculture and forestry requiring focused attention.
Currently, the most dangerous industries in Australia ranked by number of work related deaths per year are:
Transport, postal and warehousing (1122 deaths since 2003, or 56/year)
Agriculture, forestry and fishing (1045, or 52/year)
Construction (675, or 34/year)
Manufacturing (362, or 18/year)
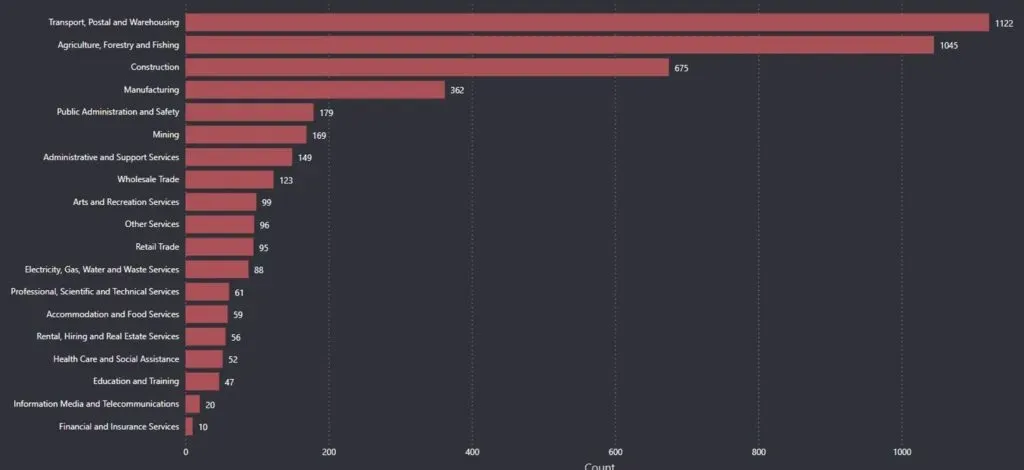
These 4 industries combined account for nearly 75% of all workplace fatalities. Fatalities in transport are often caused by vehicle incidents and fatalities in agriculture, construction and manufacturing are either vehicle incidents, plant interaction / struck by object or falls.
More Statistics on Work Related Deaths Per Year
Work-related fatalities can occur due to various mechanisms, and negligence often plays a significant role. Failure to follow occupational safety procedures, ignoring safety guidelines, lack of equipment maintenance, and working under the influence are some of the key factors that contribute to work-related fatalities. Additionally, failure to provide necessary safety equipment and personal protective gear can prove fatal.
Fatalities by Occupation
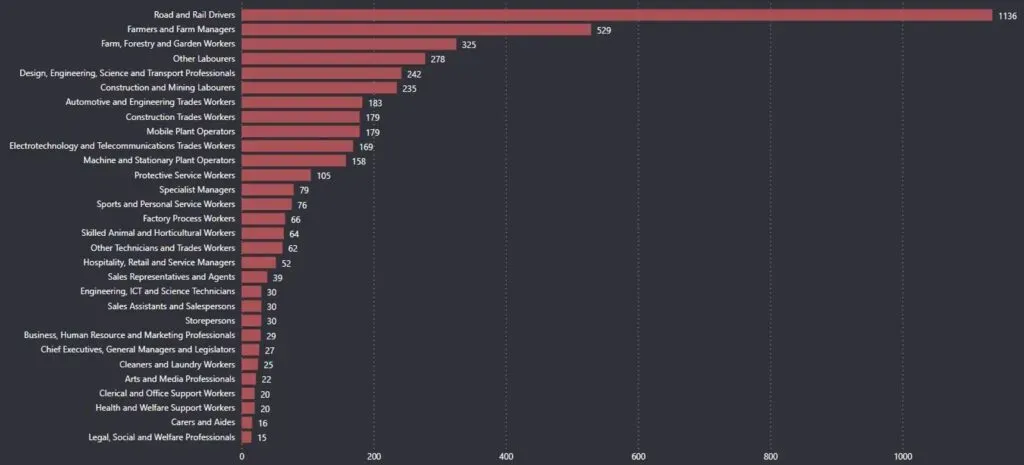
Keeping in line with fatalities by industry (transport and logistics), road and rail drivers top the list of fatalities by occupation with farmers and farm managers coming in second. The top four occupations are:
Road and rail drivers (1136 deaths since 2003, or 57/year)
Farmers and farm managers (529, or 26/year)
Farm, forestry, and garden workers (325, or 16/year)
Other laborers (278, or 14/year)
After these occupations the data is more evenly spread across 10 or so (mostly industrial workers or machinery operators) occupations.
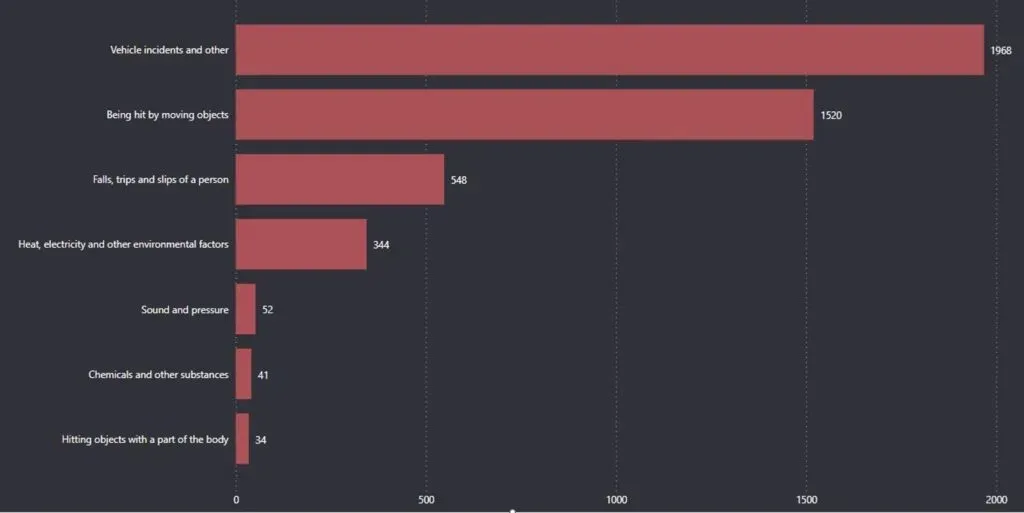
The transport, logistics and drivers theme continues, with the leading cause of work related deaths per year (by mechanism) being vehicle incidents (including other machinery / plant collisions). Hit by moving objects is a close second, with the top four mechanisms being:
Vehicle incidents and other (1968 deaths since 2003, or 98/year)
Hit by moving object (1520, or 76/year)
Falls, trips and slips (548, or 27/year)
Heat, electricity or other environmental factor (344, or 17/year)
Fatalities by Mechanism
These four mechanisms account for almost 98% of work related deaths per year, with the remaining 2% coming from all other sources (e.g. exposure to hazardous substances).
Fatalities By Age Group
Using statistics from Safe Work Australia (year 2020) shows that by far the highest fatality rate by age was for those 65 and over, with 55-64 year old coming in second. Fatality rate by age group (per 100,000 workers) is as follows:
Under 25 (0.4/100,000 per year)
25-34 (1.0)
35-44 (1.2)
45-54 (1.4)
55-64 (2.9)
65 and over (5.3)
One theory of why older age groups suffer higher rates of fatality is due to the decline in physical or cognitive function.
Fatalities by State or Territory
Our final statistic, work related deaths per year by state or territory. The Northern Territory has the (dis)honour of having the highest rate with Tasmania coming in second. Fatality per year by state is as follows:
Northern Territory (4.6/100,000 per year)
Tasmania (3.2)
Western Australia (2.1)
Victoria (1.5)
Queensland (1.4)
South Australia and New South Wales (1.3)
Australian Capital Territory (0.8)
The more developed or urbanized the state and territory is, the lower the fatality rate per worker.
What is The Role of Negligence in Work-Related Deaths?
Negligence plays a crucial role in work-related fatalities, as many of these incidents could have been prevented with proper safety measures in place. Failing to follow safety protocols, ignoring warning signs, and working without necessary precautions significantly increase the risk of work-related deaths.
To See International WHS Trends – Receive ILO News
Stay informed on the latest news and updates regarding work-related deaths per year by subscribing to the International Labour Organisation (ILO) news. The ILO is dedicated to promoting social justice and decent working conditions around the world. By subscribing to their news updates, you can stay up-to-date on the latest research, policies, and initiatives aimed at reducing work-related deaths and injuries. Stay informed and help create safer working conditions for everyone.
Detailed Strategies to Reduce Workplace Fatalities
While understanding the statistics of work-related deaths is crucial, implementing effective strategies is paramount to prevention. Businesses can significantly reduce fatalities by focusing on robust risk management, comprehensive training, and fostering a strong safety culture.
Key strategies include conducting thorough hazard identification and risk assessments tailored to specific industry risks, ensuring all plant and equipment are regularly maintained and safe for use, and developing clear Safe Work Method Statements (SWMS) for high-risk tasks. Providing ongoing and relevant WHS training to all workers, including supervisors, is essential to ensure they understand their responsibilities and safe operating procedures. This also covers fatigue management, working at heights, and vehicle safety.
Additionally, promoting a culture where workers feel empowered to report hazards and near misses without fear of reprisal is vital. This proactive approach allows organisations to learn from incidents and prevent potential fatalities before they occur. Regular safety audits and reviews help ensure that control measures remain effective and WHS systems are continuously improved.
Conclusion
In conclusion, work-related deaths in Australia are a serious issue that requires immediate attention. The statistics on work-related deaths highlight the need for stronger safety measures and preventive strategies in high-risk industries. Understanding the historical fatality trends and the mechanisms of death in the workplace can help identify areas where improvements can be made. Additionally, addressing negligence and holding responsible parties accountable is crucial in reducing work-related deaths.
FAQ
Frequently asked questions
01What is the current trend for work-related fatalities in Australia?
02How many worker fatalities occurred in Australia in 2022?
03Which industries in Australia have the highest number of work-related deaths?
04What are the leading mechanisms causing work-related deaths in Australia?
05Which age group experiences the highest rate of work-related fatalities?
06What role does negligence play in work-related deaths?
Share this resource
Need Help?
Our WHS consultants can help you implement this in your business. Book a free consultation today.
Book a Consultationor call 1300 156 382